THE PROJECT
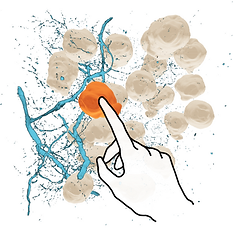
What if we could see inside healthy tissue and look at how individual cells are arranged and interact? Emerging technologies to capture the molecular properties of cells in their 3D contexts are enabling scientists to do just that. The resulting 3D tissue maps promise to shed light on how tissues function.
Nils Gehlenborg approached me to work with his team in the HIDIVE Lab and their collaborators in the Human BioMolecular Atlas Program to create visualizations that facilitate discovery with 3D tissue maps.
THE DESIGN
Through discussions with biologists, we focused the design around three key tasks:
1
visually explore
spatial relationships between different cell types
2
connect 2d and 3d
to link familiar web tools with selections made in 3D
3
measure distance
between areas of interest in a 3D tissue map


MIXED REALITY
Given the importance of seeing the data and exploring spatial relationships between cells, we used the rich stereoscopic display of an immersive headset. We ultimately chose to work with the Meta Quest 3 due to its affordability and widespread availability.
2D-3D HYBRID ENVIRONMENT
We designed a hybrid analytical environment in which a scientist can see and interact with an immersive 3D visualization of spatial data in mixed reality alongside a synchronized workspace on a 2D display visible via the headset's passthrough cameras.
INTERACTION
We chose to use hand gestures for selection, object manipulation, and distance measurements instead of more complex keyboard/mouse mappings to make the interface approachable and easy to learn.
PROTOTYPEs

Lightsheet Microscopy of Kidney Tissue
Sanjay Jain's lab
The final prototype uses an existing web framework for single cell analysis, Vitessce, and extends it with a 3D view for tissue maps. Using WebXR, we were able to synchronize visuals on both an immersive headset and a 2D display to create a hybrid analytical environment that uses both devices. Iterative rounds of prototyping and user testing informed the final design.

CyCIF of Skin Tissue
Peter Sorger's lab
MY CONTRIBUTIONS
DEFINE
the problem
Together with members of the Harvard HIDIVE lab, I worked with collaborating biologists to understand and articulate their analytical needs and pain points. I also conducted an extensive literature review of scientific papers which further informed the design.
DESIGN
the prototypes
I helped shape the project's early concept of a hybrid analytical environment that blends a 3D immersive view with a traditional 2D display. I also took the lead on the interaction design providing guidance on industry standards for hand interactions in mixed reality and providing iterative feedback on prototypes built by HIDIVE lab members.


